How We Built Our Grafana Datasource Plugin for Cloud Dependency Monitoring
4/27/2023Repost of article originally at https://metrist.io/blog/how-we-built-our-grafana-datasource-plugin-for-cloud-dependency-monitoring/
Note: Grafana has changed or moved many of the resources linked in this post since it was written.
Grafana is an incredibly powerful platform– and our company is generating some pretty interesting data. So we wanted to create a plugin for our customers so they could start to use our data to an even fuller potential.
But first we needed to build the plugin – which ended up being a pretty straightforward process, but like anything, did have a few gotchas. If you’re interested in building your own plugin, we’ll walk you through our process and hopefully it can help set you up for success.
Why Build a Grafana Datasource Plugin?
Grafana is a fantastic platform where you can quickly aggregate, visualize, and alert on data from any number of systems. Through its customizable query editors and the Datasource Plugins available you can quickly slice and dice data into usable sets that you can then feed into other tools, export, or alert on. The true power of Grafana for us involved using many of those existing Datasource plugins to do exactly these things with plugins such as Prometheus, Postgres, and AWS Cloudwatch Metrics.
An important principle at Metrist is that we want to ensure our data is available to people where they already work. This was the reason we built out our Slack integration. Having Metrist data available directly within Grafana follows that same philosophy.
What we ultimately wanted was for Metrist customers to be able to have the same tailored experience they would get with other Datasource plugins in Grafana. With a tailored query editor built specifically around Metrist concepts that our users had become accustomed to.
They would be able to filter by timeranges, data type, monitors, checks, and even individual instances. This would give them direct access to raw telemetry, error, and status page change data that they could then use in whatever way they see fit and would only require configuring the datasource with their API Token.
Based on that goal, we set out to create our own Datasource plugin with the intent of including it in the Grafana Plugin Catalog and to ensure it could also be installed in Grafana Cloud.
Our experience
Overall, integrating into the Grafana platform was relatively painless and the results have proved quite valuable.
We did end up having to navigate our way through a number of things as we built the plugin that we know could be valuable insights for others as they embark on the same journey so we’ve outlined some of them below.
Getting started
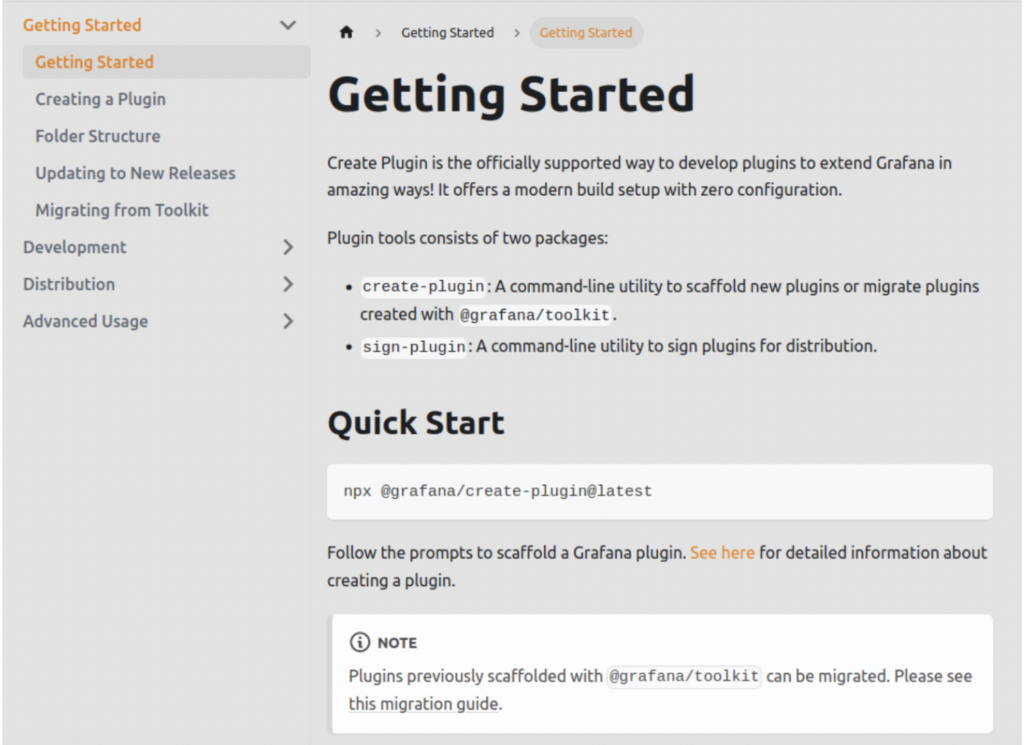
The Build a Plugin documentation provided by Grafana is a great place to start for anyone looking to build out a Grafana plugin.
Using that documentation, we were able to identify that Grafana has 2 primary ways to create Datasource Plugins. A Frontend plugin where all the querying is done via the clients browser and a Backend plugin where querying is completed by the server. You can accomplish many things with a frontend plugin but if you want to enable alerting a backend plugin is required. The backend plugin can then run the specified alerting queries periodically based on your configured timing and trigger an alert as required.
Given that Metrist definitely wanted the ability for users using our Datasource plugin to hook into alerting, the Backend plugin was what we went forward with.
Setting up the initial plugin is painless with Grafana’s plugin tools. These tools will scaffold all the boilerplate needed for your plugin. It also includes a docker-compose file for a local Grafana instance, an initial test framework, and Github actions for CI and release management.
By using those tools, you can start working on your specific implementation very quickly and if you’re building a datasource plugin one of the next things you will likely be looking at is the data format your plugin has to generate. Enter Dataframes.
Dataframes
Dataframes are integral to any Grafana datasource plugin. All data returned from a Datasource plugin must adhere to the Dataframe formats supported by Grafana itself. When we initially built our plugin, we had built up the dataframes in what we thought was a natural way using the Golang structs we had available. It worked great until we upgraded Grafana and then all sorts of Javascript errors started being thrown in the console. It turned out that we weren’t strictly adhering to the requirements. The following Markdown description of the frame formats proved invaluable in ensuring those frames were set up correctly.
Our plugin ended up making use of both the Time Series Multi format and the Time Series Wide format for different use cases which we will discuss in more detail below.
Tailoring the output format using Frame Formats and Frame Metadata
Dataframes and their Metadata become especially important in helping Grafana itself decide how to visually display the data.
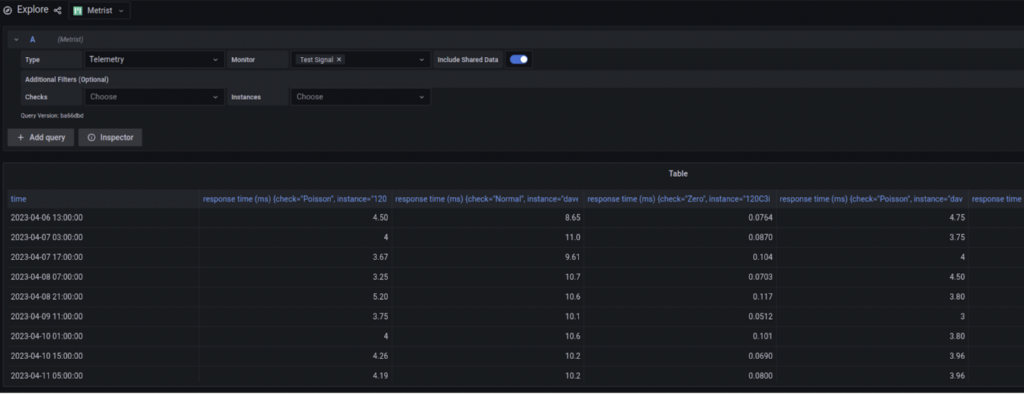
Which Dataframe formats you use has many implications. Alerting as an example wants a returned table with a single time field and single number. The frames can include labels which are extremely useful for alerting as they can be substituted into alerting messages to provide context. That meant that Time Series Multi was a natural choice for that. Time Series Multi also works really well when using graph visualizations in Grafana. But what about the tabular view? The table view is displayed in numerous places such as the “Explore” area and is also used when exporting data from Grafana. Tables being output in multi format result in a column with a hard to read name for every set of label combinations which is not really readable or easily manipulated.
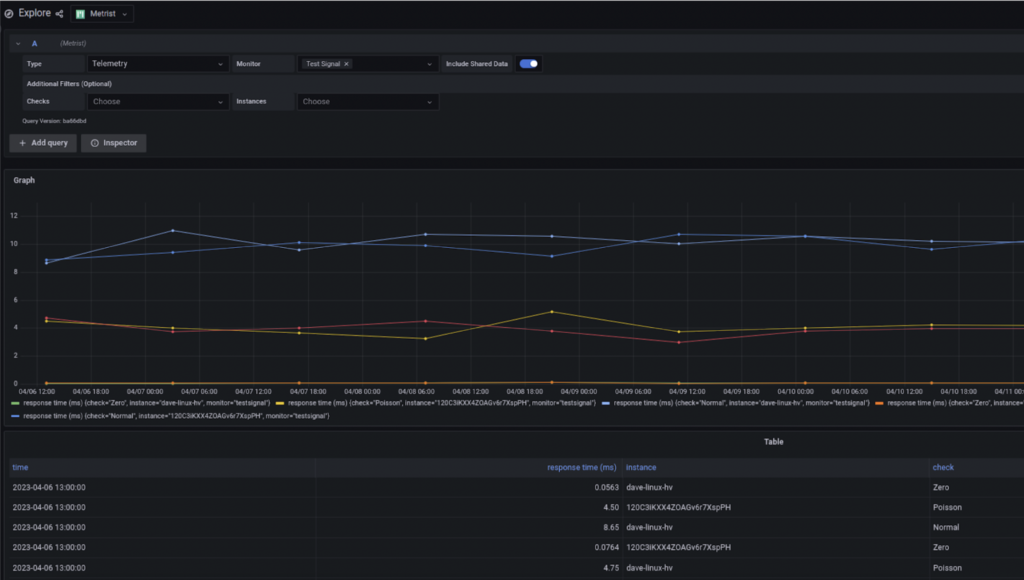
To address that we ended up including two sets of frames in two different formats in the response and to tell Grafana which frames should be used for graphing and which frames should be used for tabular display via the frame metadata. We ended up discovering this strategy by using the Grafana Inspector and looking at the returned JSON data from other Datasource plugins that were displaying everything in the desired way. The PreferredVisualization field of the frame Meta metadata field allows you to identify which frames should be used for Graph visualizations vs Tabular visualizations with VisTypeGraph and VisTypeTable respectively.
That solution worked great, but it did end up resulting in another problem in the alert manager query editor as it was having a problem with both sets of frame data in the response. For its purposes it only wanted the Multi formatted set. The solution to this ended up coming from the app property on the QueryEditorProps in the QueryEditor react component. By checking if that property was set to CoreApp.CloudAlerting or CoreApp.UnifiedAlerting we could determine if we were querying from alerting and if so only include the one set of frames.
Backend Datasource Callbacks
One thing we knew we wanted to do was to make filtering easy and intuitive within our custom query editor. We wanted to allow users to choose from context specific options based on what was present within their account. To do this, we decided to leverage GetResource from the query editor which would then call back into our backend plugin which could pull appropriate data for the filter multi selects.
There’s a great forum post from a Grafana team member alluding to using this technique for data driven dynamic filters in your query editors but it doesn’t actually describe how you would pass parameters to your backend plugin.
Ultimately, all resource requests from the QueryEditor end up at the CallResource datasource method in your backend instance as described in the post. The key to getting your passed params is to parse the query string from the CallResourceRequest URL field which will include them.
Getting Your Plugin Into The Catalog
Now that we had alerting working, our query editor setup, and all the visualizations displaying as we would like. The last step for us was getting our plugin into the catalog so that it could be made available to everyone in the Grafana ecosystem.
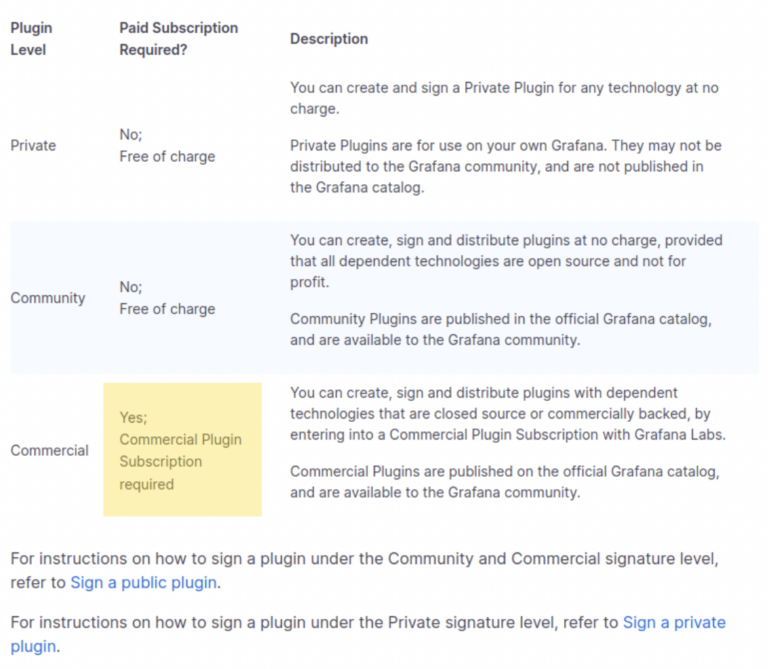
To do that, we have to address the elephant in the room. If any part of your product that you are pulling data from or integrating into is closed source, we would highly recommend that you reach out to Grafana to determine what the cost of your Commercial Plugin Subscription will be before you start development. Without it, you will not be able to sign your plugin for public distribution or include it in the catalog. Being included in that catalog is also what enables your plugin to be installed on Grafana Cloud instances which are being used more and more today. The only real reference on the grafana.com docs site you will find to this requirement is on the Sign a plugin under plugin signature levels. We had seen that callout, and were fully prepared to pay a fee for that license but you won’t find mention of the fee itself anywhere on the Grafana site.
Unfortunately, the fee ended up being so cost prohibitive that it was out of reach for us as a small startup company and we had to abandon our catalog and cloud ambitions. We do feel that the one size fits all commercial plugin subscription fee doesn’t really foster more development of commercial plugins by organizations other than Grafana Labs themselves or massive organizations. That said, we do understand the position but do hope that accommodations can be made by Grafana in the future to allow smaller commercial organizations to participate in what we believe to be a great platform at a more palatable fee. We feel this would only help expand the Grafana plugin ecosystem and be an ultimate benefit to Grafanas users.
Where We Ended Up
Metrist ended up with a fully functional and complete Grafana data source plugin. It wasn’t difficult to put together thanks to the Grafana team’s tooling and was largely a pleasant experience. We did run into a few roadblocks but were able to navigate around them by exploring how similar roadblocks had been circumvented by other plugins.
We believe strongly in Dogfooding at Metrist and we use the plugin ourselves on our own on prem install and find it extremely valuable when exploring a given time period or issue. We could certainly pull all the data for an investigation from our datastores but not as quickly as we can visualize and dissect it in Grafana.
If you feel that having access to your telemetry, error, and status page data within Grafana itself would be valuable to you and you are running your own on prem Grafana instance please let us know and we can help you get setup with the datasource.